
Agriculture field notes
Practical guides to smart agriculture, crop intelligence, agricultural GIS, satellite monitoring, and field verification.
122 articles · Page 6 of 11
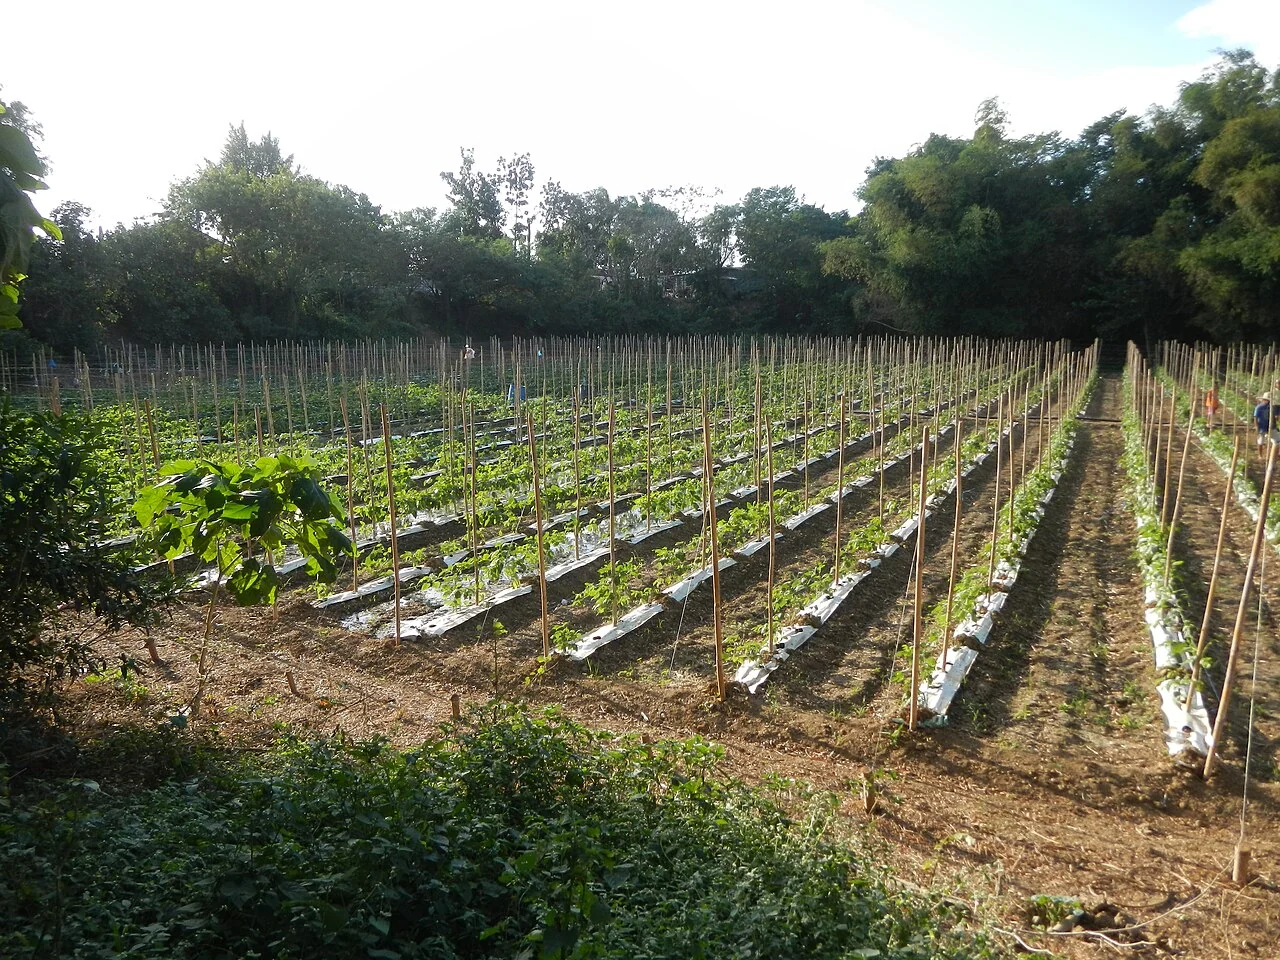
NDVI for agriculture: useful patterns and common mistakes
Use NDVI to compare vegetation patterns within a suitable context, inspecting the red and near-infrared inputs and the quality mask. Check field observations before assigning agronomic meaning.
Read article ↗
NDRE and red-edge bands in crop monitoring
State the exact near-infrared and red-edge bands used, because different formulations and sensors are not identical. Compare observations within the same processing method and crop context.
Read article ↗
NDMI and crop-canopy moisture: interpreting the signal
Use the near-infrared and shortwave-infrared relationship as contextual information on canopy moisture-related variation. Review rainfall, crop stage, and ground observations alongside the map.
Read article ↗
Clouds, shadows, and usable satellite observations
Inspect the quality mask over the actual field, not only a scene-wide cloud percentage. Review shadows, thin haze, field edges, and the number of valid pixels remaining after masking.
Read article ↗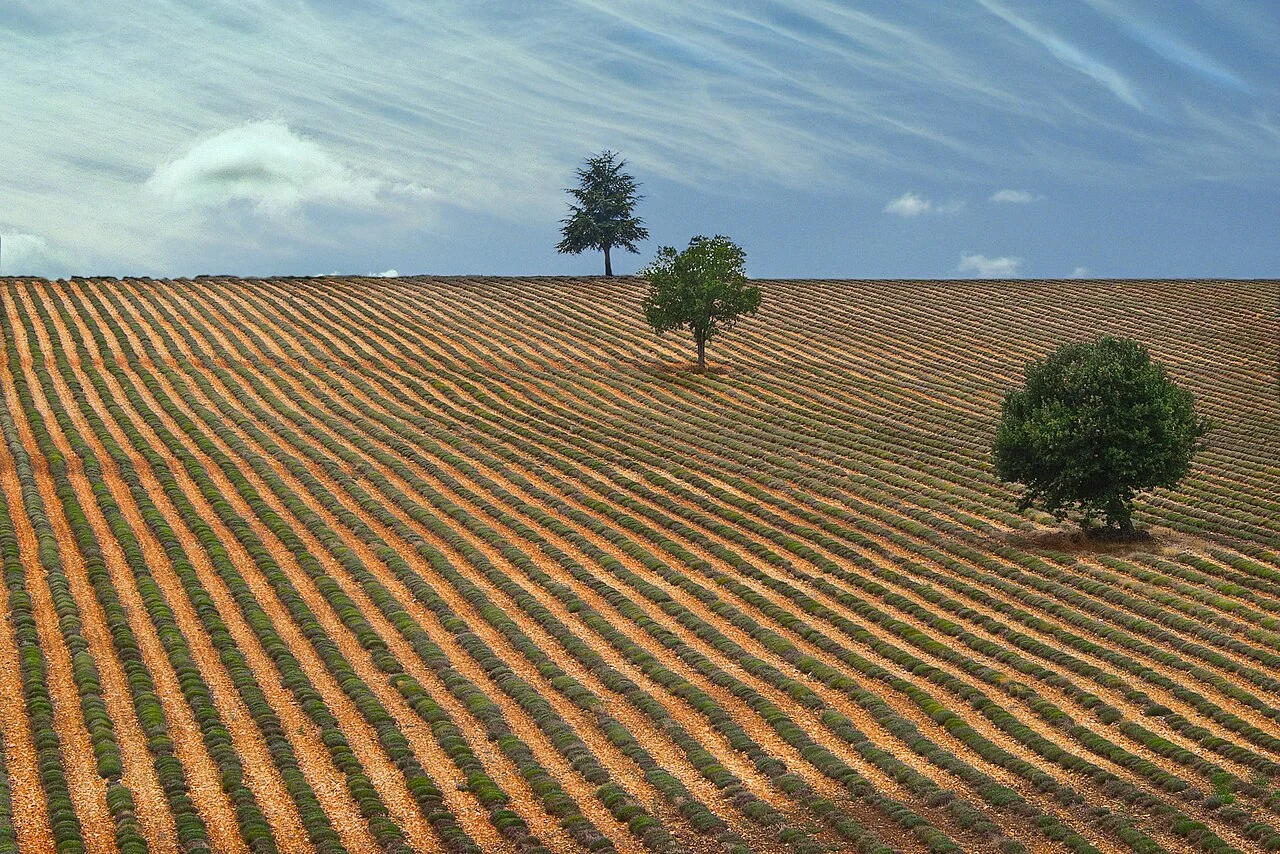
Monthly crop composites: dates and uncertainty matter
Document which dates contribute to the composite and how values are selected or combined. Inspect whether fields are represented by different parts of the month.
Read article ↗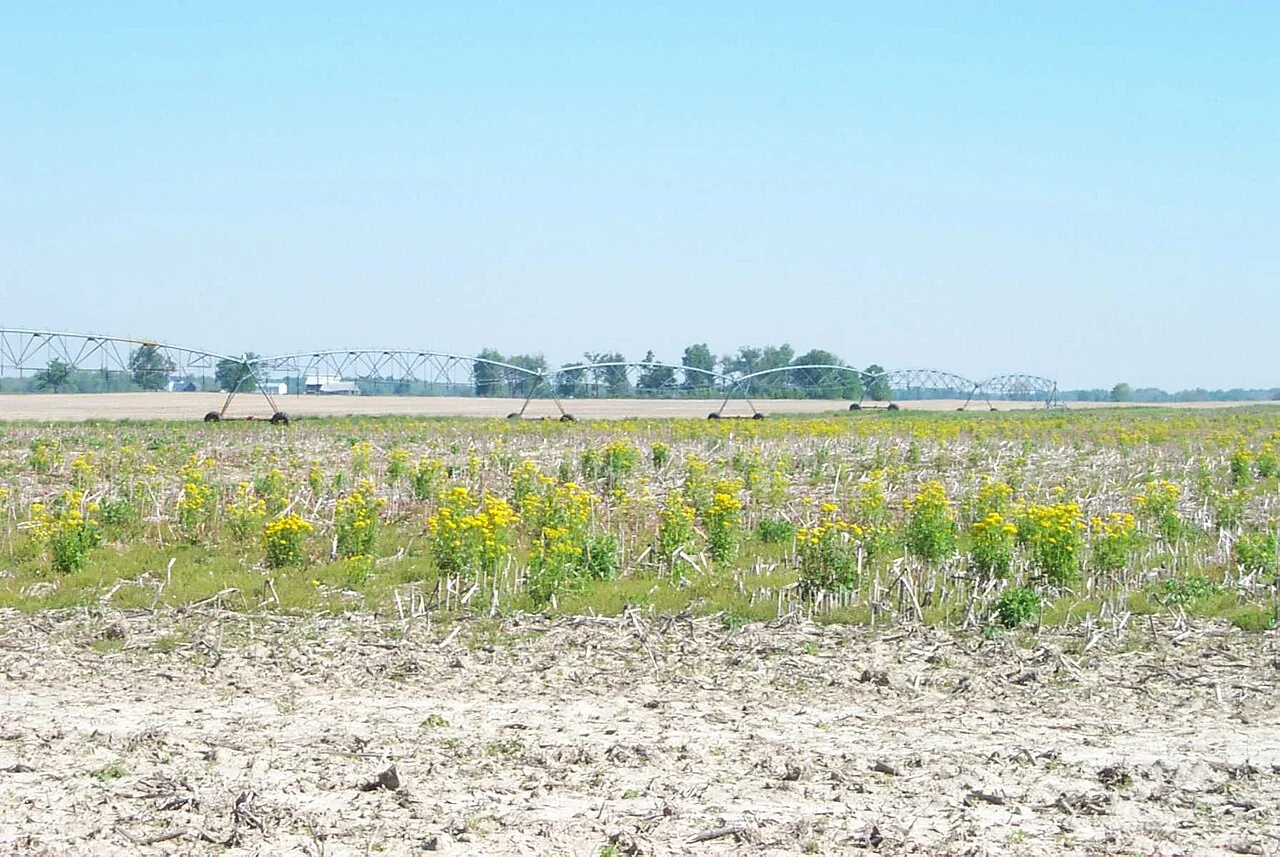
Radar imagery for agriculture under persistent cloud
Define the observation mode, orbit direction, terrain treatment, and crop context before comparing radar backscatter. Use suitable reference observations to interpret surface and canopy changes.
Read article ↗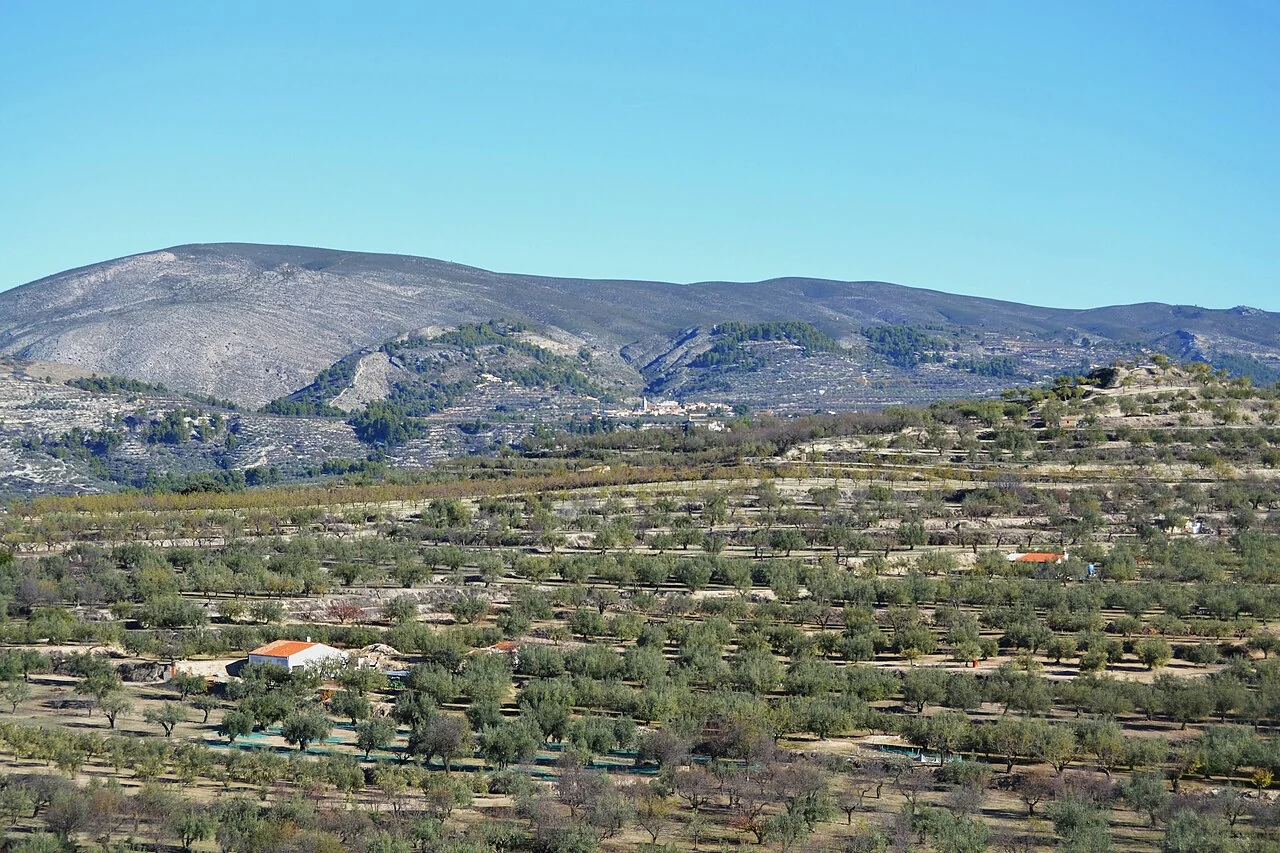
Satellite field-edge effects and mixed pixels
Inspect how roads, trees, drains, neighbouring crops, and polygon alignment affect the pixels included in a field summary. Consider an interior buffer only if enough representative area remains.
Read article ↗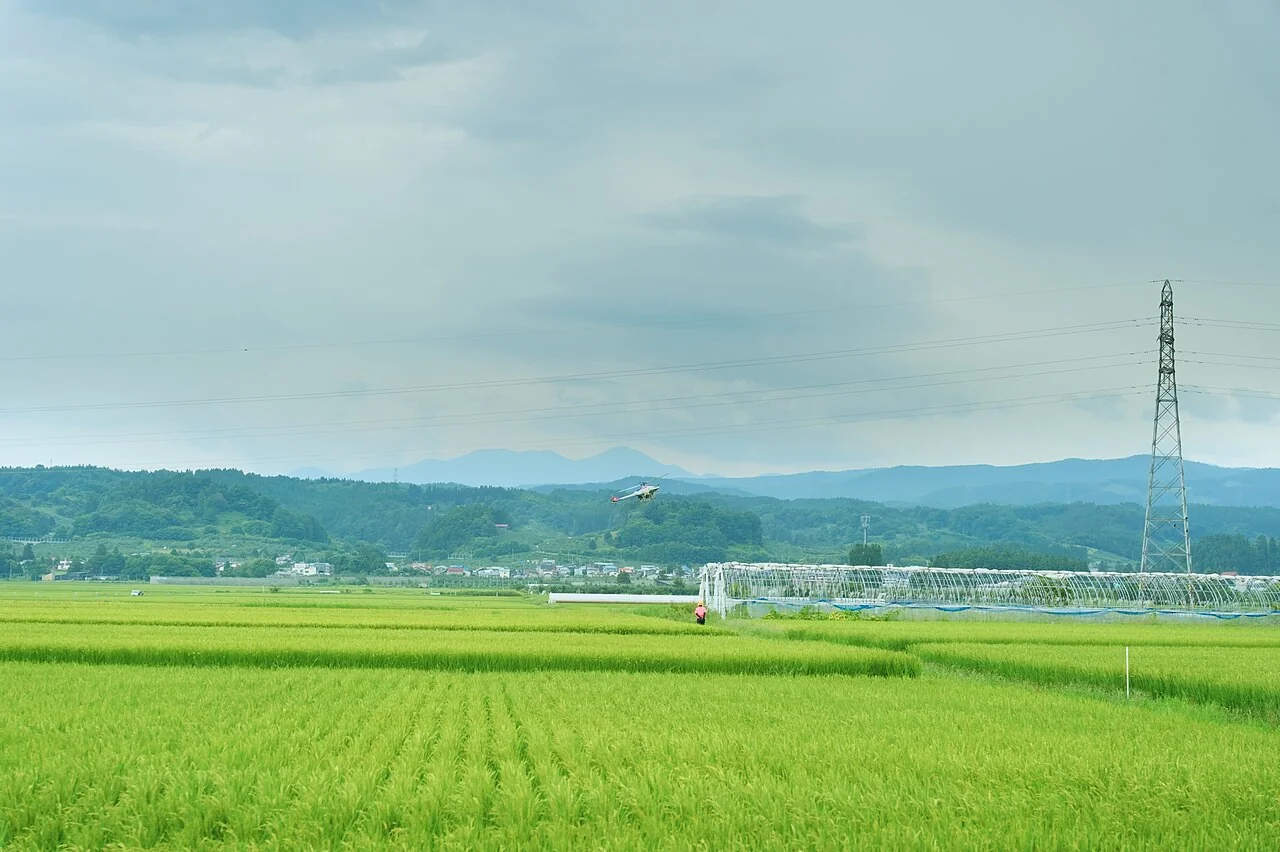
Comparing satellite and drone vegetation maps
Align acquisition dates, band definitions, radiometric treatment, resolution, and the field boundary before comparing patterns. Aggregate to a meaningful common scale rather than matching colours by eye.
Read article ↗
Crop anomaly alerts: from threshold to confirmed observation
Define an alert as a request for review and test it against normal management events. Record whether each alert is confirmed, dismissed with a reason, or still awaiting evidence.
Read article ↗
Bring field evidence back to the agricultural map
Design each survey question to support an identifiable decision, and connect observations with photographs, dates, coordinates, and the appropriate field code. Test the entire collection-to-review cycle.
Read article ↗
Digitising agricultural boundaries with quality control
Choose the image date and the intended boundary meaning before digitising. Distinguish planted extent, operational block, drainage reserve, and land-rights boundaries instead of merging them into one polygon.
Read article ↗
Coordinate reference systems for agricultural GIS
Identify the coordinate reference system for every source and choose an appropriate projected system for local area or distance analysis. Preserve the original metadata when exporting or sharing.
Read article ↗See your land from a more connected perspective.
Choose a commodity and explore the AgroSensing workspace.