Start with the operational question
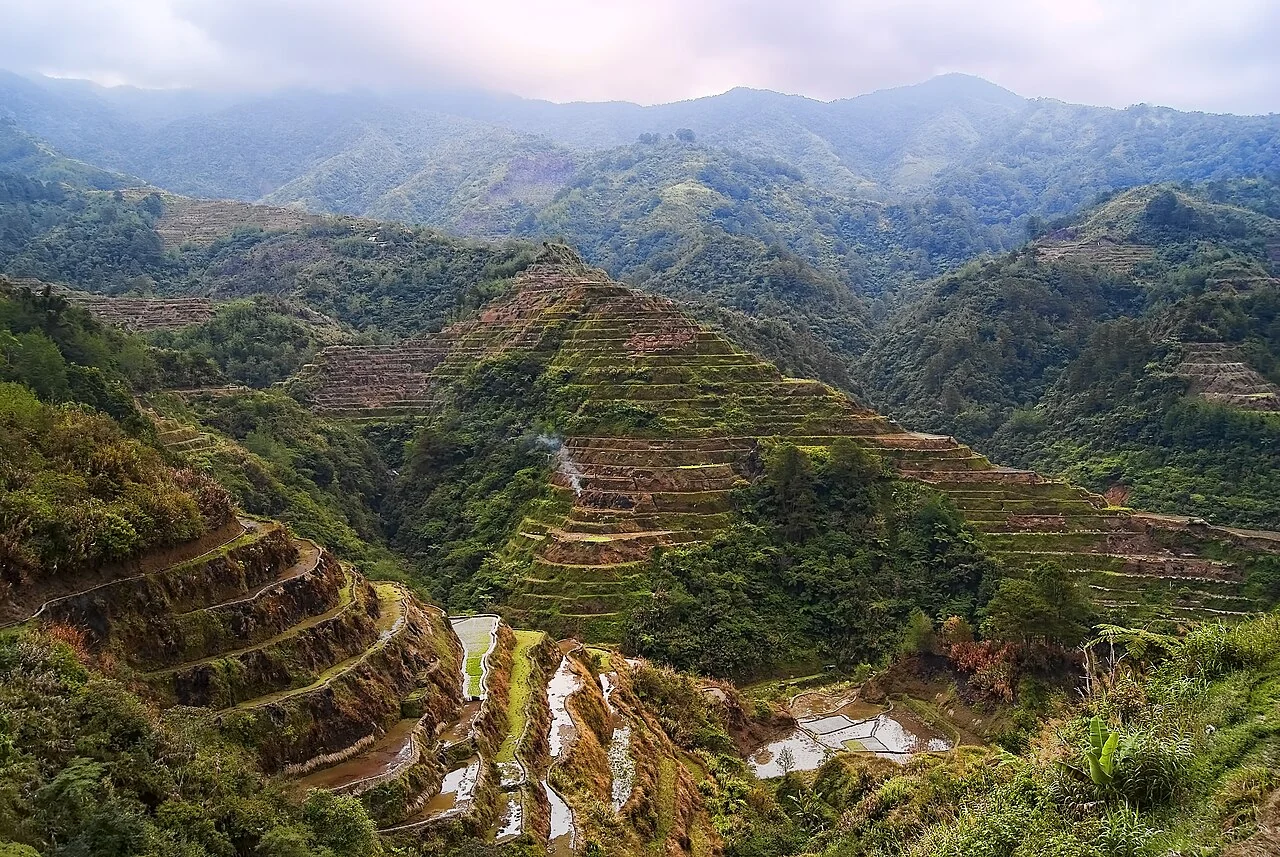
Choose the image date and the intended boundary meaning before digitising. Distinguish planted extent, operational block, drainage reserve, and land-rights boundaries instead of merging them into one polygon.
Separate observation from explanation
Visible vegetation edges can differ from operational or legal boundaries. Tiny slivers, overlaps, self-intersections, and inconsistent snapping can undermine area and adjacency calculations.
Review geometry and what the boundary means
Choose the boundary type before drawing: planted extent, operational field, management zone, ownership claim, or authoritative parcel. These can overlap without being identical. Record the source image date, survey method, coordinate reference system, and the person responsible for approval. Keep uncertain segments visible for field review.
Check for self-intersections, slivers, duplicate features, unintended overlaps, gaps, and inconsistent snapping according to the intended dataset. Inspect the geometry over the original image and against field observations. A polygon can be geometrically valid while representing the wrong field, so technical validation must be accompanied by a review of meaning and identity.
Calculate area using an appropriate method and stated units, then reconcile significant differences with the field register. Preserve earlier versions when a revision affects historical reporting. Do not treat a digitised vegetation edge as legal evidence of tenure. Deliver the geometry, metadata, identifiers, uncertainty, and correction history together so that later users can understand and maintain the boundary.
Read article: Coordinate reference systems for agricultural GIS
Match spatial detail to the question
Agricultural GIS connects field boundaries, observations and imagery, but each dataset has its own spatial support. A point marks a location, a polygon describes an area and a raster pixel summarises a footprint. They should not be treated as equivalent measurements. Before overlaying layers, check their coordinate reference systems, dates and units. A visible alignment problem can arise from a coordinate or georeferencing issue rather than movement or change in the crop itself.
Sentinel-2's bands have different native spatial resolutions. Its visible and broad near-infrared bands are available at finer resolution than its red-edge and shortwave-infrared bands. Resampling can put those bands onto a common grid, but it does not create new observed detail. When a field is narrow or small, boundary pixels may mix crop with roads, trees, water or neighbouring land. Explain that mixture before interpreting a field average as a pure crop measurement.
Preserve quality and time information through the analysis
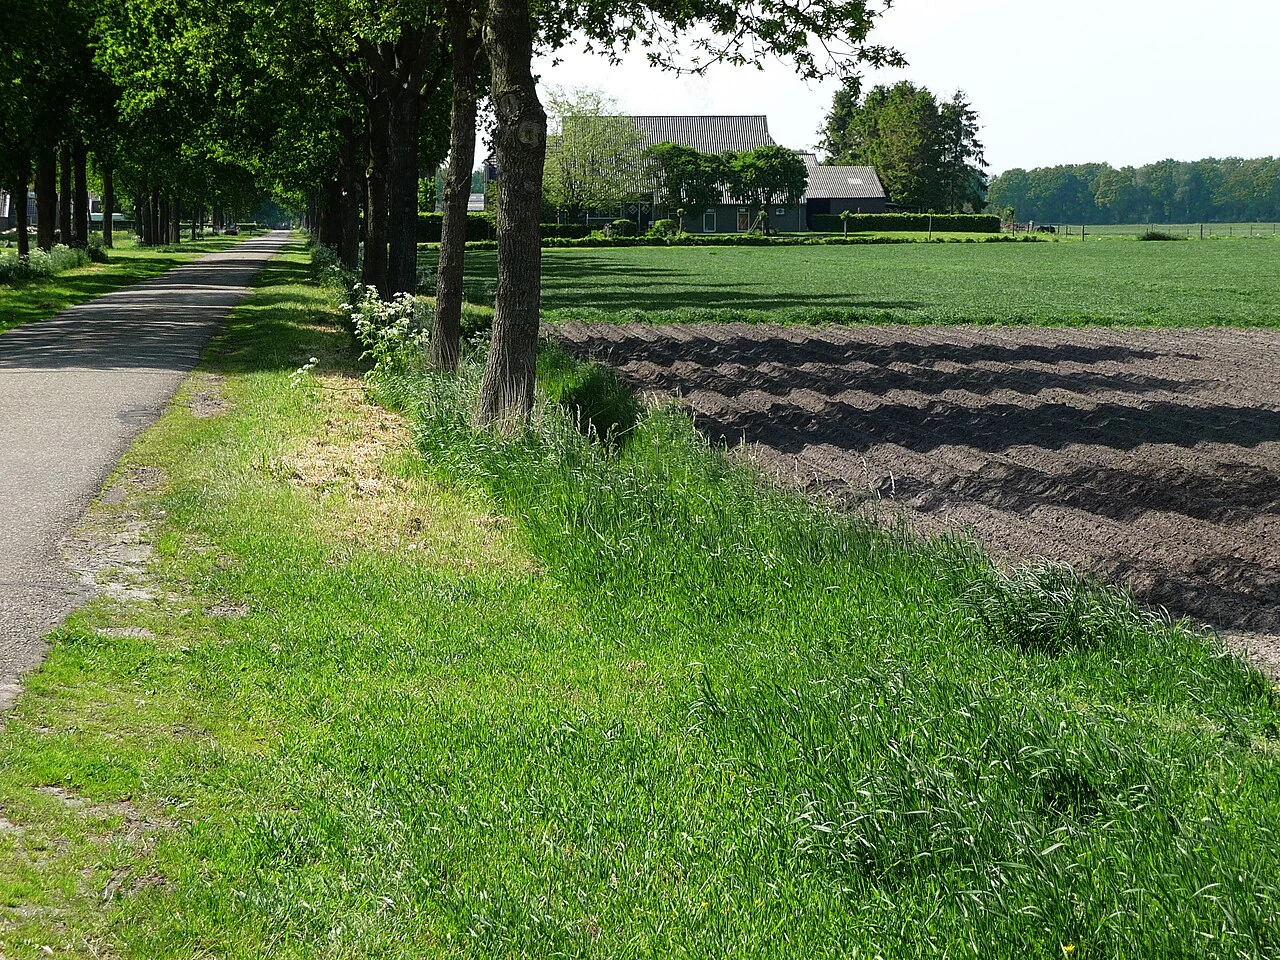
Optical imagery requires attention to clouds, haze and shadows. A scene with a small overall cloud percentage may still have the target field obscured. Inspect the actual area of interest and retain the masking or quality method used. Compare compatible products and document processing choices, especially when building a time series from different dates or sensors. An unexplained jump may be a data-quality issue rather than a sudden change in vegetation.
Vegetation indices describe combinations of reflected spectral signals. USGS explains that NDVI is sensitive to soil background and can saturate in dense vegetation. Therefore an index is best interpreted with crop stage, canopy structure and field evidence. A colour class is not a direct measurement of nutrient concentration, disease identity or harvestable yield. Those interpretations need suitable calibration and validation, and any prediction should retain its uncertainty and the conditions under which it was evaluated.
Make maps reproducible and useful for the next observer
Keep the original inputs, analysis date, method version and relevant parameters with the output. Use a clear legend that distinguishes observed values, derived indicators and unverified candidates. Where a statistic excludes cloudy pixels or non-crop areas, document the exclusion and the valid coverage. If the coverage changes between dates, acknowledge that the averages may represent different parts of the field. This is especially important when a report turns a sequence of maps into a trend.
Design the validation around the intended use. A model for one crop and season should be tested on independent examples that represent the conditions where it will operate. Field checks should look for missed objects as well as incorrect proposed objects, and classification checks should include each meaningful category. Retain the disagreements and review their causes rather than removing difficult cases. A map becomes operationally valuable when another person can follow its evidence, understand its limits and decide what observation is needed next.
Check coordinate meaning before measuring
A coordinate pair needs a declared reference system, axis interpretation, and units. Identify these for every incoming layer and keep the original definition with the source. Check representative locations against independently known points or a trusted reference. A layer displayed in the right general region can still contain a significant local offset.
Choose a suitable projected coordinate system or an explicitly geodesic method for distance and area. Degrees are angular units and should not be handled as metres. Document transformations, including the datum relationship and available accuracy information. If the source system is unknown, investigate it rather than assigning a convenient definition solely to make the map appear aligned.
Verify exports in the receiving application. GeoJSON coordinate order and coordinate-system conventions differ from the conventions of some survey files. Check representative features after conversion, retain meaningful identifiers, and avoid excessive decimal precision that implies unsupported accuracy. Report the measurement method and the location uncertainty that matters to the operational decision.
Read article: Crop anomaly alerts: from threshold to confirmed observation
Keep identifiers, history, and evidence connected
Use a stable identifier for each field or asset and store its descriptive name separately. The identifier should remain useful when a crop changes, staff move, or an operational unit is subdivided. Define relationships explicitly: one field may have many visits, one visit may have several photographs, and one harvest lot may refer to several fields. Document those relationships before combining spreadsheets or map layers.
Changes need an effective date and a reason. Preserve earlier geometry or attribute versions when a correction affects historical reports. Record who approved the change and which source supported it. Correcting a boundary should not silently rewrite the area that was used for a previous season unless the report is intentionally revised and the revision is explained.
Test an export by bringing representative records back into the receiving workflow. Check that identifiers, dates, units, text encoding, coordinate interpretation, and missing values survive. Keep an unaltered source copy and a transformation note. A simple data dictionary and a named owner for each dataset often prevent more errors than an elaborate visual interface without clear responsibilities.
Define the deliverable and approval
Deliver reviewed polygons with boundary type, source date, coordinate reference system, topology checks, uncertainty notes, and a route for field-team approval.
A practical review before sharing the result
Check the observation against its source and make sure the field identifier is correct. Review dates, units, missing values, quality exclusions, and geometry versions. Ask a colleague to reproduce one representative result from the recorded inputs. This small independent check often exposes a misunderstood field code or a processing assumption before it affects an entire report.
Write down the alternative explanations for the mapped pattern and identify what evidence would distinguish them. Keep a measured observation separate from the interpretation and from any treatment or management instruction. A decision should name its responsible reviewer and account for local operating procedures. If the evidence is insufficient, the appropriate output is a targeted inspection rather than a confident claim.
Keep the original result, any reviewed version, and a short change log. State which locations and periods the output can reasonably describe. When sharing a map, provide a clear legend, source dates, and an accessible explanation of uncertainty. The recipient should know whether a feature is a confirmed observation, a candidate awaiting inspection, or a model-based estimate.
Read article: GeoJSON and GeoTIFF in a farm-mapping workflow
Turn the investigation into a repeatable field cycle
Prepare the visit with a map that can be used at the intended location and a concise list of questions. Confirm access, permissions, equipment, and the availability of a person familiar with the field. Choose representative stops as well as unusual areas. Record where the planned route could not be followed, because missing observations can change how the result should be interpreted.
After the visit, review the observations while the team can still clarify them. Connect photographs, measurements, and comments to the same field and visit identifiers. Assign a follow-up status and preserve unresolved cases. A correction should explain what changed and why; it should not erase the original evidence or make an earlier interpretation appear to have been certain.
At the next suitable observation date, compare conditions using the same definitions and review any management or weather events that occurred between visits. Record the action actually completed and its operational outcome. This creates an evidence trail from an initial pattern to field confirmation and later review, making the mapping process easier to improve over successive seasons.
Connect this work with AgroSensing
Use a connected spatial workflow to organise imagery, commodity records, and geolocated field observations. Discuss the appropriate data, validation, and operating scope with the team.
Sources and further reading
The linked primary references explain the underlying agronomic and geospatial concepts. The field workflows in this guide are editorial recommendations to adapt with the responsible local specialist.