Start with the operational question
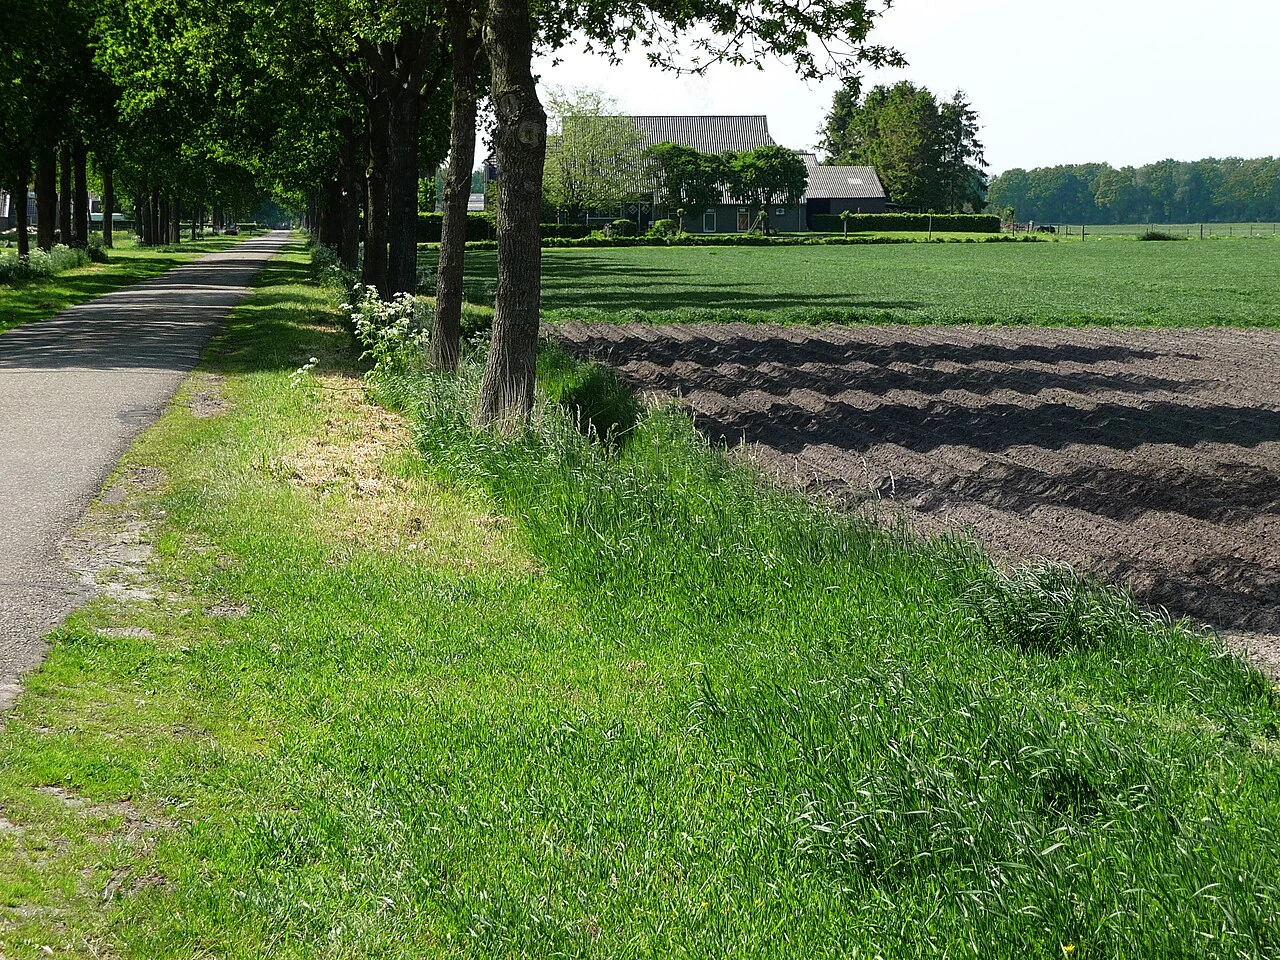
Map field margins, flowering vegetation, water features, hedges, and other habitat structures according to the local observation objective. Link the structures with appropriately timed field observations.
Separate observation from explanation
Visible habitat does not prove that a particular beneficial species is present or that a pest-control benefit has occurred. Seasonal flowering, mowing, chemical use, and sampling method influence the ecological interpretation.
Define map classes and evaluate their errors
Write class definitions that a field observer can apply. Distinguish the mapped land cover from land use, ownership, and legal status. Decide how to handle mixed areas, temporary management states, shadows, and uncertain cases. Collect reference observations across the conditions that the final map is expected to represent.
Keep model development and evaluation observations independent where possible. Neighbouring samples can share information, so a random split of nearby pixels may overstate generalisation. Review errors by class and by relevant field conditions rather than publishing only one overall score. Rare but operationally important classes deserve explicit attention.
Retain uncertain areas and explain the minimum useful mapping unit. Inspect candidate changes in the original imagery and management record before interpreting a class transition as a real conversion. Deliver the class dictionary, source dates, validation method, known limitations, and correction process with the map. A colour legend alone does not explain the evidence behind the assigned classes.
Read article: Integrated pest-management observations and hotspot maps
Start from a decision that can be checked in the field
A smart-agriculture workflow begins with a specific question: which area needs inspection, which operation is due, or which observation would resolve an uncertainty? Define the management unit and the person who will use the result before collecting data. A field boundary, a sampling location and a delivery lot are different objects; keep their identifiers separate and document their relationships. This prevents information from appearing more spatially precise than the underlying records allow.
List the evidence needed for that question. Crop stage, management history, soil observations, water measurements and imagery may each contribute, but they are not interchangeable. Use consistent units and record when a value is measured, estimated or unavailable. A missing measurement should remain visibly missing. Filling an empty cell with a plausible number can make a dashboard look complete while weakening the decision it was supposed to support.
Before a new campaign, ask another team member to interpret a sample record without help. Ambiguous labels, undocumented units or unclear observation dates are easier to correct before hundreds of records have accumulated.
Use maps to organise observations and comparisons
FAO's crop-monitoring work shows the role of geospatial information in understanding agricultural systems. A practical farm workflow combines that spatial overview with observations at the scale of the decision. Map potential differences, inspect representative locations and retain what was actually found. Record both expected and unexpected observations. If only the places that confirm the initial interpretation are retained, the resulting dataset will provide a misleading basis for future monitoring or model development.
Compare similar crops, stages and management conditions whenever possible. A strong difference between two fields may reflect their sowing dates rather than the effect of a treatment. For a small trial, write down the comparison plan and record other management differences before reviewing the outcome. A before-and-after photograph alone does not establish a causal effect. Weather, crop development and simultaneous operations can all contribute to the observed change.
Judge the workflow by the quality of its follow-up
A useful output describes its source dates, coverage, method and unresolved questions. For an image-based result, retain quality information and explain where cloud or shadow prevents interpretation. For a field observation, retain the sampling method and the observer's record. When combining datasets, show which time periods and locations actually overlap. A visually convincing overlay can still combine evidence that describes different events, so checking those relationships is part of the analysis.
Measure progress in terms of completed and reviewed decisions: an inspection resolved, an irrigation problem verified or a sampling plan improved. Record the cost and effort if the team wants to evaluate operational value, and distinguish measured savings from expectations. No single sensor, index or software platform establishes a universal gain in yield or profit. The practical goal is a traceable cycle in which evidence informs a decision, the action is recorded, and later observations help the team improve its next decision.
Design reference observations that represent the field
State the population that the sample should represent and the question it must answer. Select locations across relevant crop stages, terrain, management, and image conditions. Include ordinary areas and difficult cases, not only conspicuous anomalies or convenient roadside stops. Record selection rules so that later users understand where the reference is representative.
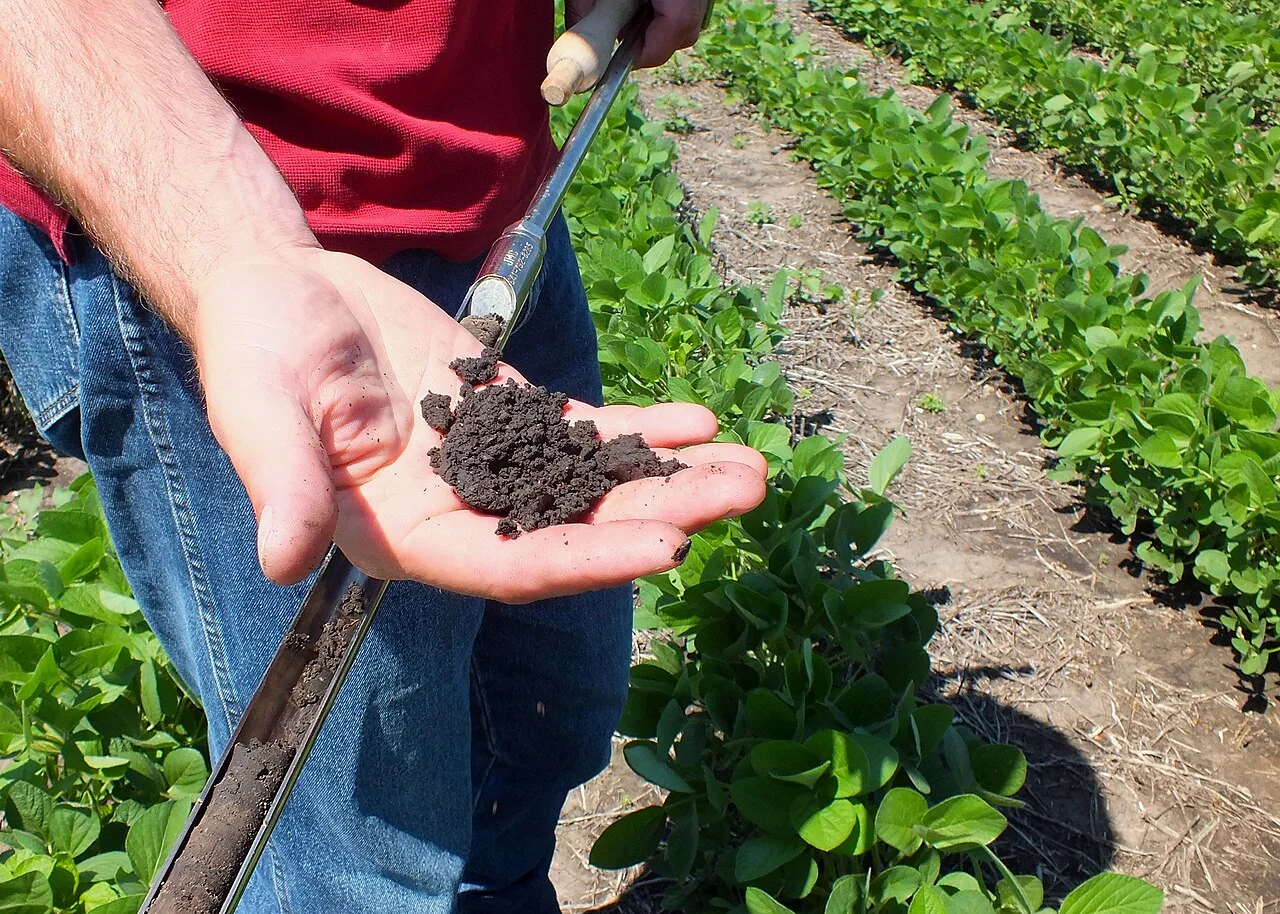
Define the observation unit, area or depth, timing, instrument or laboratory method, and required replicates using the appropriate discipline's protocol. A point observation and a satellite pixel have different spatial support. Record enough context to evaluate that mismatch. Keep inaccessible sites in the sampling log and explain any replacement rather than silently dropping them.
Separate reference collection from the result being evaluated when feasible. Review observer consistency and missing data before calculating agreement or error. Retain raw observations, corrections, and exclusions with their reasons. More samples can improve precision, but a large biased sample still fails to represent excluded conditions. Use the results within the population and period that the sampling design supports.
Read article: Agricultural storm documentation: keep a reliable event record
Check the support behind every mapped value
Inspect the source over the actual field of interest. Scene-wide metadata can conceal a cloud, shadow, blurred strip, incomplete survey, or alignment problem exactly where the decision is needed. Record the date, spatial support, quality flags, and valid coverage for each field. An observation with little usable support should remain unavailable rather than being filled with an apparently plausible value.
Review missing values and exclusions separately from valid measurements. A zero, an unvisited location, a masked pixel, and a sensor error describe different circumstances. Preserve the reason for missing data through the summary stage. If an estimated value is used, mark it as estimated and explain the method so that it cannot be mistaken for an independent observation.
Choose acceptance rules before comparing outcomes. Apply them consistently to favourable and unfavourable results. Retain a small collection of difficult examples and revisit it after processing changes. Quality review should include omissions and inaccessible areas as well as the records that were successfully produced. A transparent incomplete dataset is more useful than an apparently complete map whose unsupported values cannot be identified.
Define the deliverable and approval
Deliver a habitat context map with class definitions, management dates, reference observations, uncertainty, and a plan for evaluating any proposed habitat intervention.
A practical review before sharing the result
Check the observation against its source and make sure the field identifier is correct. Review dates, units, missing values, quality exclusions, and geometry versions. Ask a colleague to reproduce one representative result from the recorded inputs. This small independent check often exposes a misunderstood field code or a processing assumption before it affects an entire report.
Write down the alternative explanations for the mapped pattern and identify what evidence would distinguish them. Keep a measured observation separate from the interpretation and from any treatment or management instruction. A decision should name its responsible reviewer and account for local operating procedures. If the evidence is insufficient, the appropriate output is a targeted inspection rather than a confident claim.
Keep the original result, any reviewed version, and a short change log. State which locations and periods the output can reasonably describe. When sharing a map, provide a clear legend, source dates, and an accessible explanation of uncertainty. The recipient should know whether a feature is a confirmed observation, a candidate awaiting inspection, or a model-based estimate.
Read article: Spatial nutrient budgets: connect inputs, outputs, and uncertainty
Turn the investigation into a repeatable field cycle
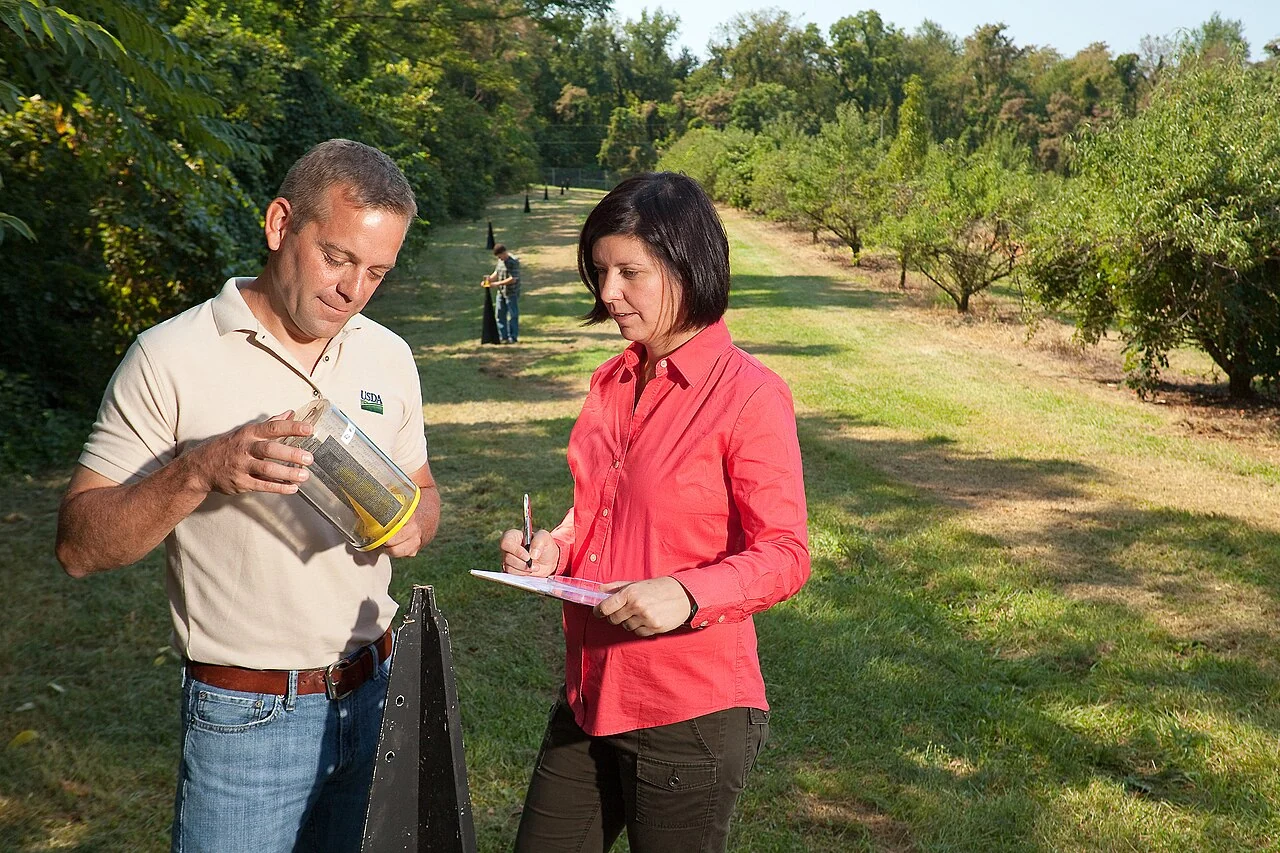
Prepare the visit with a map that can be used at the intended location and a concise list of questions. Confirm access, permissions, equipment, and the availability of a person familiar with the field. Choose representative stops as well as unusual areas. Record where the planned route could not be followed, because missing observations can change how the result should be interpreted.
After the visit, review the observations while the team can still clarify them. Connect photographs, measurements, and comments to the same field and visit identifiers. Assign a follow-up status and preserve unresolved cases. A correction should explain what changed and why; it should not erase the original evidence or make an earlier interpretation appear to have been certain.
At the next suitable observation date, compare conditions using the same definitions and review any management or weather events that occurred between visits. Record the action actually completed and its operational outcome. This creates an evidence trail from an initial pattern to field confirmation and later review, making the mapping process easier to improve over successive seasons.
Connect this work with AgroSensing
Use a connected spatial workflow to organise imagery, commodity records, and geolocated field observations. Discuss the appropriate data, validation, and operating scope with the team.
Sources and further reading
The linked primary references explain the underlying agronomic and geospatial concepts. The field workflows in this guide are editorial recommendations to adapt with the responsible local specialist.